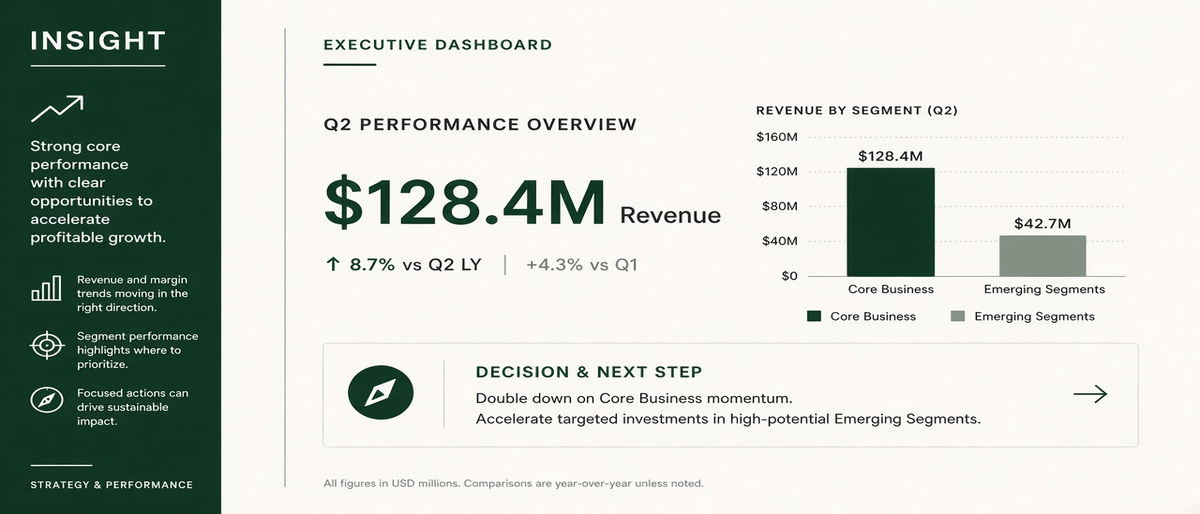
The Canadian enterprise landscape in 2026 is defined by an unprecedented velocity of data and the transformative potential of agentic AI. Leaders are awash in information, yet often starved for true insight. Traditional dashboards, once revolutionary, are increasingly becoming sources of 'data fatigue' – overwhelming screens of metrics that describe what happened, but fall short of guiding decisive action.
At Optimal Works, we recognize that the challenge isn't merely to display data; it's to engineer an experience where data speaks directly to strategic imperatives. It’s about moving beyond static reports to cultivate decision-ready visualizations that empower leaders to act with confidence and agility.
The Evolution of Insight: Why Traditional Dashboards Are No Longer Enough
For years, the dashboard was the holy grail of business intelligence. It offered a centralized view of key performance indicators (KPIs), bringing data out of spreadsheets and onto screens. However, in today’s complex, fast-moving environment, their limitations are stark:
- Descriptive, Not Predictive or Prescriptive: Most dashboards tell you what happened, not why it happened, what might happen next, or what to do about it.
- Lack of Context: Numbers without narrative can be misleading. Leaders need to understand the underlying drivers, interdependencies, and external factors influencing the data.
- Overwhelm and Analysis Paralysis: Too many metrics, too little focus. Leaders often spend precious time sifting through irrelevant data points rather than honing in on critical insights.
- Static and Inflexible: While some offer drill-downs, many lack the dynamic, exploratory power required for nuanced strategic inquiry. They don't adapt to evolving questions.
- Disconnected from Action: The leap from seeing a metric decline to understanding its root cause and formulating a strategic response is often left entirely to the leader, unsupported by the visualization itself.
What Defines Decision-Ready Visualization in 2026?
Decision-ready visualization is not just about aesthetics; it’s about engineering clarity, context, and a clear path to action. It’s a synthesis of art and science, designed to support high-stakes executive decisions. Here are its core characteristics:
1. Strategic Alignment and Focused Narratives
Every visualization must start with a strategic question. Instead of presenting all available data, decision-ready visuals are meticulously curated to answer "What is our greatest strategic risk right now?" or "Where should we allocate resources for maximum impact?" They tell a coherent story, framing the data within the broader organizational context and guiding the viewer towards a specific understanding or conclusion.
2. Dynamic Exploratory Analysis, Guided by Purpose
Leaders need to explore, but efficiently. Decision-ready tools offer intuitive pathways for deep dives, allowing executives to investigate anomalies, test hypotheses, and understand causality without getting lost in a data labyrinth. This is achieved through intelligent design that anticipates common follow-up questions and provides relevant contextual data points on demand, often leveraging underlying exploratory data analysis (EDA) performed by expert analysts.
3. Contextual Intelligence and Predictive Foresight
Beyond current performance, leaders need to see the future. Integrating predictive analytics and scenario modeling directly into visualizations allows for "what if" analysis. What happens if market conditions shift? How will a regulatory change impact our operations? Moreover, contextual intelligence means presenting external benchmarks, historical trends, and relevant qualitative insights alongside quantitative data.
4. Simplicity, Clarity, and Action-Oriented Design
Complex problems do not require complex visuals. The hallmark of decision-ready visualization is its ability to distill intricate data into clear, unambiguous insights. This demands a deep understanding of human perception and cognitive load. Visuals should highlight critical information, minimize distractions, and explicitly suggest potential actions or areas for further investigation, effectively bridging the gap between insight and initiative.
Pillars for Building Your Decision-Ready Visualization Capability
A. Embrace Deep Exploratory Analysis as a Prerequisite
Before any dashboard or visualization is designed, robust exploratory data analysis (EDA) is non-negotiable. This involves statisticians and data scientists delving into datasets to uncover patterns, anomalies, relationships, and outliers. This foundational work ensures that the subsequent visualizations are built on sound insights, addressing the right questions and presenting meaningful relationships, rather than just raw numbers. It’s about understanding the 'why' before visualizing the 'what'.
B. Prioritize User-Centric Design and Data Storytelling
Effective visualization isn't about throwing data onto a chart; it's about understanding the decision-maker. What are their priorities? How do they consume information? What biases might they hold? Design thinking principles, coupled with a strong emphasis on data storytelling, are crucial. This means crafting narratives around the data, using visual elements to draw attention to key insights, and structuring the flow of information to guide the leader towards a clear understanding and potential action.
C. Anchor Everything in Robust Data Governance
The most sophisticated visualization is worthless if the underlying data is untrustworthy. In 2026, with the proliferation of data sources and the increasing reliance on AI-driven insights, impeccable data governance is the bedrock of decision-ready visualization. This includes data quality, lineage, access controls, and clear ownership. Leaders must have absolute confidence that the data presented is accurate, consistent, and compliant, especially within the Canadian regulatory context. Without this foundation, any visualization effort is built on sand.
D. Leverage Augmented Analytics and AI for Enhanced Insights
Agentic AI and augmented analytics are not replacements for human insight but powerful accelerators. They can identify patterns, outliers, and correlations that human analysts might miss, automate routine data preparation, and even suggest optimal visualization types. Integrating these capabilities allows teams to focus on higher-value interpretation and strategic guidance, making the journey from data to decision significantly faster and more precise.
Actionable Takeaways for Canadian Enterprise Leaders:
- Shift Your Mindset from Reporting to Strategic Storytelling: Challenge your teams to move beyond simply presenting metrics. Demand visualizations that answer "So what?" and "Now what?" for your most critical strategic questions. Invest in training your analytics teams in data storytelling and design thinking principles.
- Audit Your Existing Dashboards for Decision-Readiness: Conduct an honest review. Do your current dashboards facilitate immediate decision-making, or do they primarily describe past events? Identify key executive decisions and redesign visuals specifically to support those processes, eliminating clutter and adding context.
- Strengthen Your Data Governance Foundation: Recognize that decision-ready visualization is impossible without trusted data. Prioritize initiatives to improve data quality, establish clear data ownership, and ensure robust data lineage. This investment will pay dividends across all your data-driven initiatives, including AI adoption.
In 2026, the competitive edge belongs to organizations that can not only collect vast amounts of data but also transform it into actionable intelligence at speed. Optimal Works partners with Canadian enterprises to navigate this complex landscape. Our expertise in data analysis, visualization strategy, program management, and data governance helps leaders bridge the gap between data deluge and decisive action. We guide organizations in building the capabilities and frameworks necessary to create truly decision-ready insights, ensuring your data strategy directly fuels your strategic advantage.
Let's unlock the full potential of your data, transforming it from a source of overwhelm into your most powerful strategic asset.
Discuss this with your team
Optimal Consulting helps enterprises deliver on Data analysis & visualization—from strategy through execution.
Book a consultation