The year 2026 presents Canadian enterprise leaders with a paradox: more data than ever, yet often, fewer truly clear answers. The sheer volume of information, coupled with escalating market volatility and the rapid integration of AI into business processes, demands an evolution beyond traditional business intelligence. Static dashboards, while foundational, are no longer sufficient. Leaders today require decision-ready visualizations—insights so precise, so contextualized, and so actionable that they directly inform strategic moves and drive competitive advantage. This transformation begins not with the dashboard itself, but with the often-overlooked power of rigorous exploratory data analysis (EDA).
The Challenge: Drowning in Data, Thirsty for Insight
Many organizations have invested heavily in data collection and reporting tools. Yet, a common refrain from executive suites is a lack of actionable insight. Dashboards often present a deluge of metrics without a clear narrative, leaving leaders to connect the dots themselves. This "data swamp" scenario means valuable time is spent interpreting rather than deciding. The problem isn't a lack of data; it's a lack of structured inquiry and intelligent presentation that translates raw information into strategic intelligence. Without a deep understanding of the underlying data's characteristics, biases, and potential relationships, even the most sophisticated visualization tool can merely beautify ambiguity.
Exploratory Data Analysis: The Unseen Foundation of Strategic Insight
Exploratory Data Analysis (EDA) is the critical first step in transforming raw data into decision-ready insights. Far beyond simple data profiling, EDA involves a systematic investigation of a dataset to discover patterns, detect anomalies, test hypotheses, and check assumptions with the help of statistical graphics and other data visualization methods. For leaders, this isn't about becoming a data scientist, but about understanding the value of this rigorous pre-work.
Unlike traditional reporting, which often starts with a predefined question, EDA embraces curiosity. It asks: "What stories does this data want to tell?" It’s the process of:
- Uncovering Hidden Relationships: Identifying correlations or causal links between different data points that might not be immediately obvious.
- Spotting Anomalies and Outliers: Pinpointing unusual data points that could signal critical issues or unique opportunities.
- Validating Data Quality: Ensuring the data is clean, consistent, and reliable before any conclusions are drawn—a crucial step for trust.
- Framing the Right Questions: Using initial discoveries to refine the strategic questions that visualizations will ultimately answer.
This deep dive ensures that when a dashboard is finally constructed, it’s built on a solid, well-understood foundation, addressing the true needs of the business, not just surface-level metrics. It moves the conversation from "what happened?" to "why did it happen, and what should we do next?"
From Exploration to Decision-Ready Visualizations
Once the data has been thoroughly explored, the art and science of decision-ready visualization can truly begin. This isn't just about making charts look appealing; it's about crafting a visual narrative that guides leaders directly to the insights they need to make informed choices.
Key elements of decision-ready visualizations include:
- Strategic Alignment: Every visual element, from chart type to colour scheme, should directly support a core business objective or question.
- Contextual Richness: Data points are presented with relevant benchmarks, trends, and qualitative context, helping leaders understand the "so what."
- Action Orientation: Visualizations should clearly highlight areas requiring attention, potential risks, or emerging opportunities, often suggesting next steps or areas for further investigation.
- Interactivity and Drill-Down: Leaders should be able to explore data at different levels of granularity, moving from high-level summaries to detailed underlying factors with ease.
- Predictive and Prescriptive Elements: Beyond reporting on the past, decision-ready visuals often incorporate forecasts or recommendations, leveraging advanced analytics to look forward.
The goal is to move beyond mere reporting towards a dynamic, insightful experience that empowers proactive decision-making across the enterprise.
Principles for Impactful, Decision-Ready Visualizations
To achieve this, several core principles must guide the design and implementation process:
1. Audience-Centric Design
Understand the specific needs, questions, and cognitive load of your target leader. What decisions are they trying to make? What information do they absolutely need, and what is merely noise? Customization is key, moving away from one-size-fits-all dashboards.
2. Clarity and Simplicity
Complex data does not demand complex visuals. The most effective visualizations are often the simplest, stripping away clutter to highlight the essential message. Use intuitive chart types and consistent visual language.
3. Context is King
Present data within its relevant business context. Is a metric up or down? Compared to what? What external factors might be influencing it? Providing benchmarks, historical trends, and qualitative insights transforms numbers into meaningful intelligence.
4. Action Orientation
Every visualization should implicitly or explicitly answer the question: "What should I do?" or "What should I be aware of?" Highlight deviations from targets, emerging patterns, or critical thresholds that demand a leader's attention.
5. Data Governance as the Bedrock
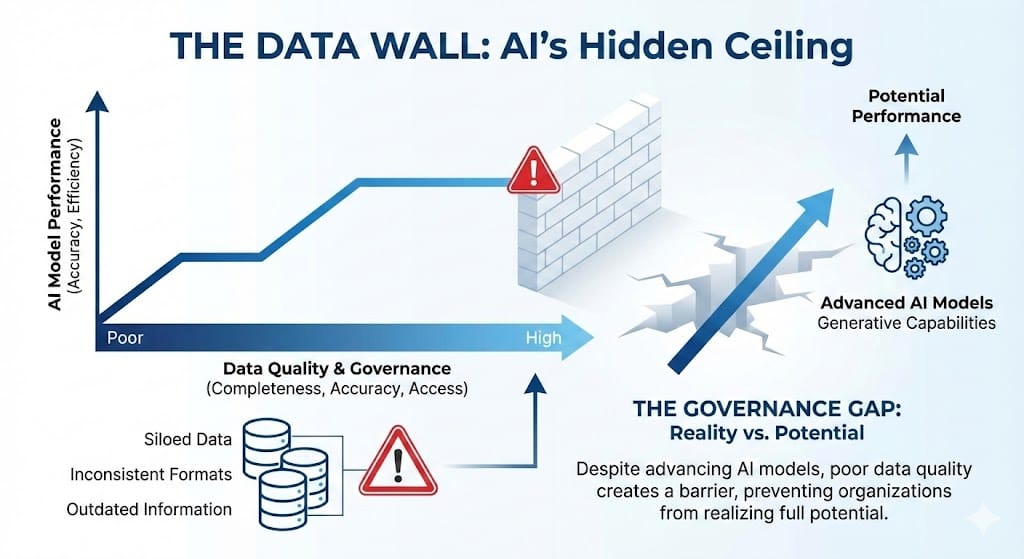
No visualization, however brilliant, is trustworthy without sound data governance. Leaders must have absolute confidence in the accuracy, consistency, and lineage of the data underpinning their decisions. Robust governance frameworks ensure data integrity from source to screen.
Actionable Takeaways for Canadian Enterprise Leaders
- Prioritize Exploratory Data Analysis: Shift resources towards a rigorous EDA phase before committing to dashboard development. This investment in understanding the data's nuances will prevent costly redesigns and ensure the final visualizations truly address strategic needs. Treat EDA not as an optional step, but as the foundational blueprint for all subsequent data products.
- Design for Decisions, Not Just Display: Challenge your teams to move beyond presenting metrics. Every dashboard and visualization should be explicitly designed to answer a strategic question, highlight an opportunity, or flag a risk, directly enabling a specific decision or action. Encourage a "so what?" mindset in every data presentation.
- Cultivate Data Literacy and a Culture of Inquiry: Empower your leadership and operational teams with the skills to interpret complex visualizations and, more importantly, to ask critical questions of the data. Foster an environment where curiosity about data is encouraged, and where insights, not just reports, are valued.
How Optimal Works Can Help
At Optimal Works, we partner with Canadian enterprises to navigate the complexities of data, transforming it into clear, decision-ready intelligence. Our expertise spans comprehensive data analysis, sophisticated visualization design, robust data governance frameworks, and strategic advisory. We help organizations build the capabilities to move beyond static reporting, implementing advanced exploratory analysis techniques and crafting dashboards that empower leaders with the insights needed for proactive, impactful decision-making. From strategy to execution, we ensure your data assets drive tangible business value.
Conclusion
In 2026, the competitive edge belongs to those who can extract true strategic insights from their data. By embracing rigorous exploratory analysis and designing visualizations specifically for leadership decisions, Canadian enterprises can unlock unparalleled clarity and agility, turning data into their most powerful strategic asset.
Discuss this with your team
Optimal Consulting helps enterprises deliver on Data analysis & visualization—from strategy through execution.
Book a consultation